GRE General Test Eligibility: Age Limit, Educational Qu...
There are no official eligibility criteria set by ETS for appearing in the GRE General Test. The GRE...

10 Proven SAT Preparation Tricks & Strategies
SAT Prep Strategies can make a huge difference between an average score and a dream score, which ope...

Best Time to Start GRE, TOEFL & IELTS Preparation
The best time to start GRE prep depends on your target test date, current readiness, and whether you...

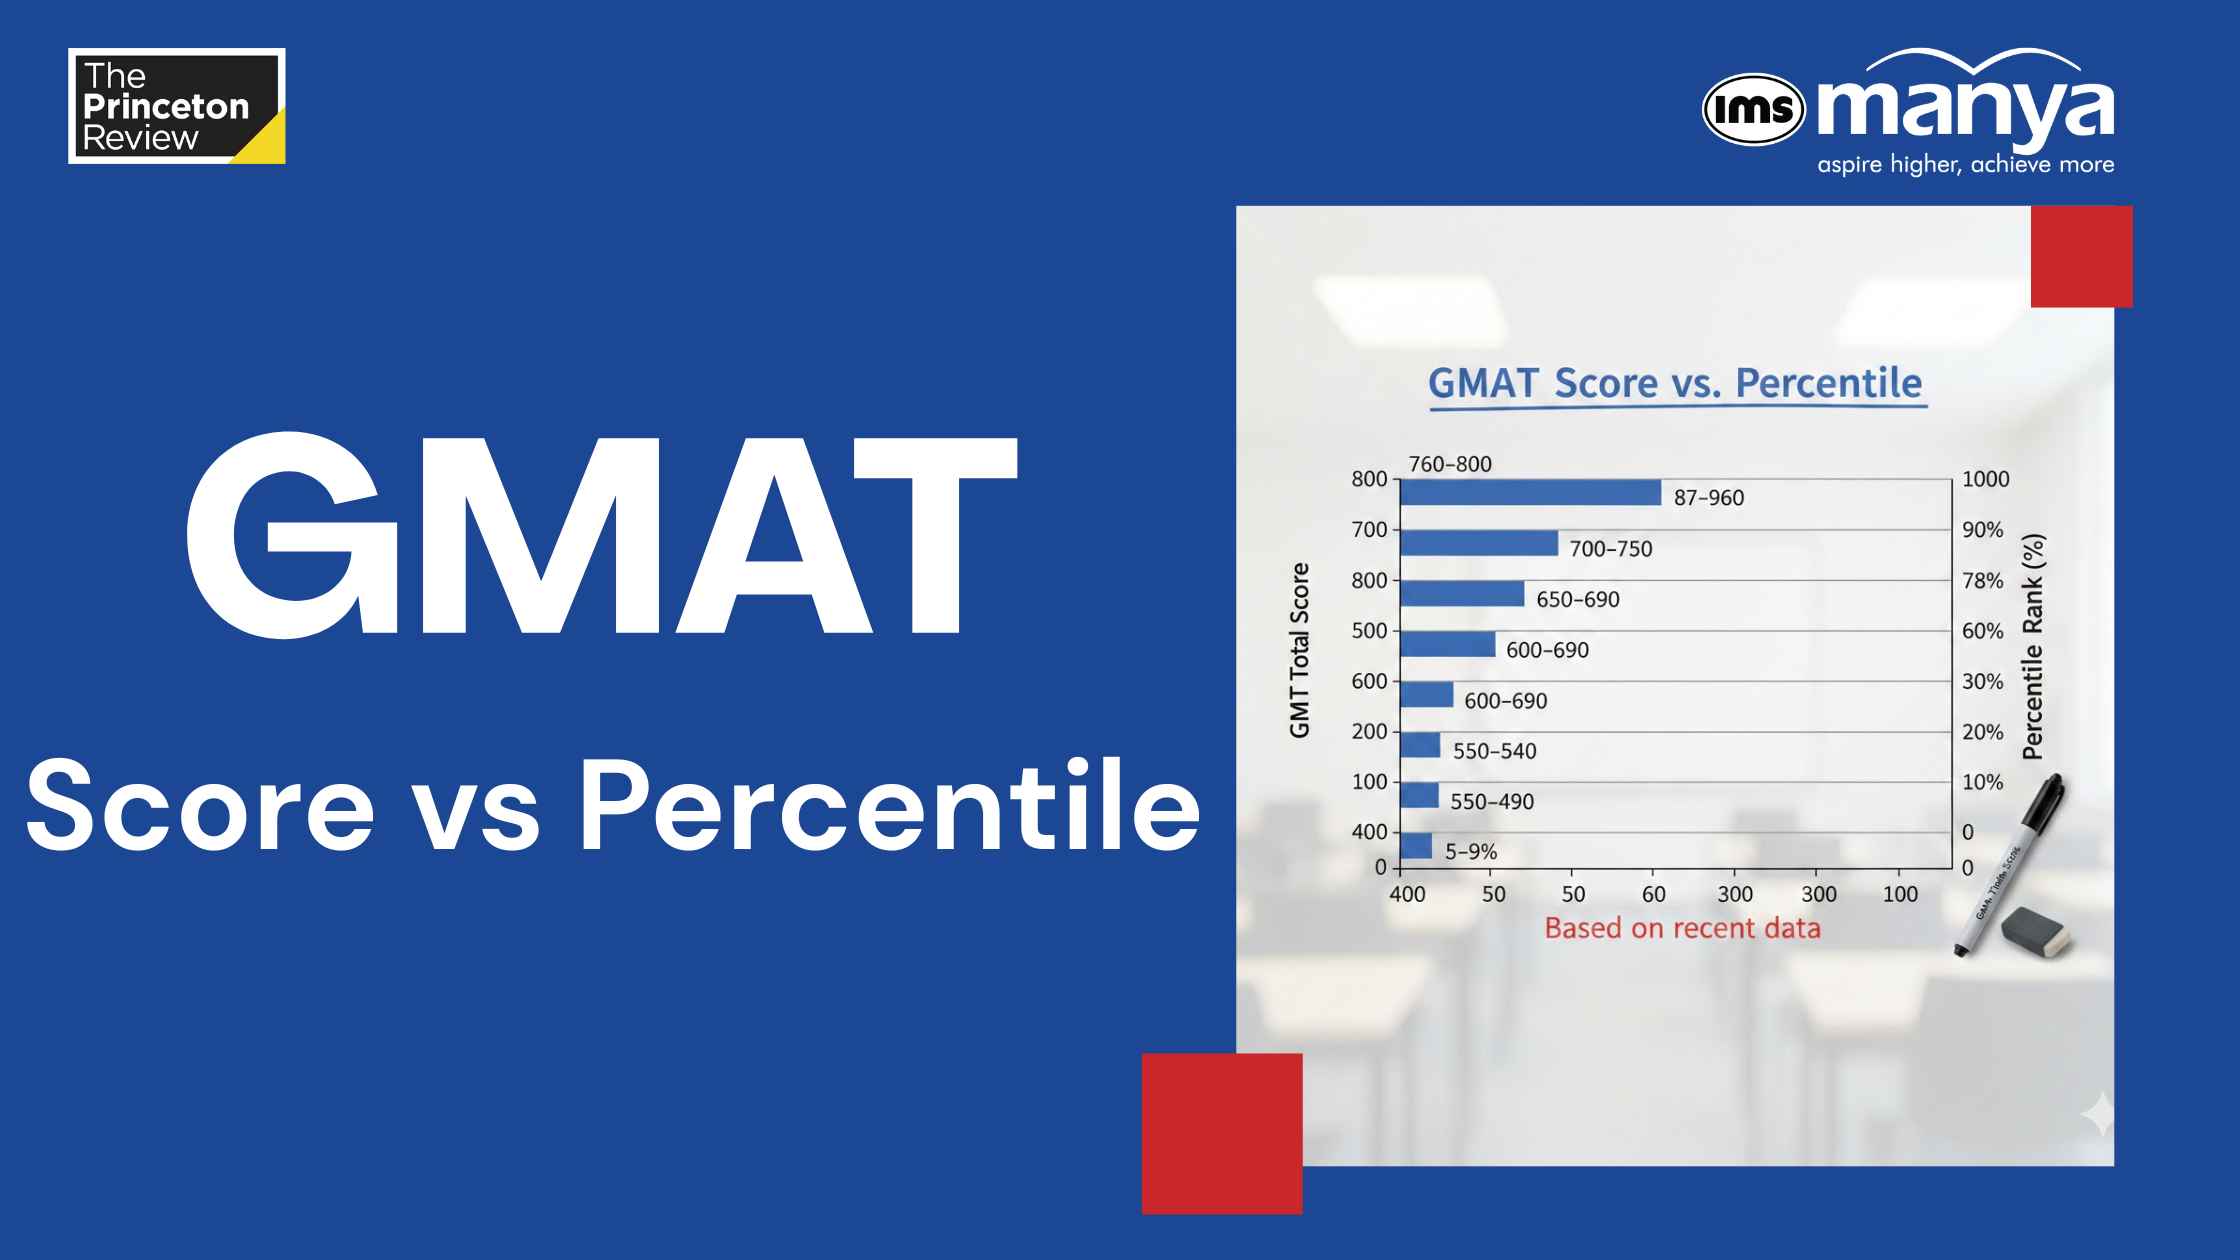
GMAT Score vs GMAT Percentile: A Complete Guide
If you’ve recently looked up GMAT score vs GMAT Percentile, you must have witnessed specific confu...

ISB Hyderabad MBA Admission | Fees, Placements, & more
The ISB Hyderabad MBA admission process remains one of the most sought-after management programs in ...

GRE On-Screen Calculator: How to Use It - In Detailed E...
Preparing for the GRE General Test can feel challenging at times, but with the right strategy and gu...

How to Increase GRE Scores: 10 Proven Tips for 320+
If you’re searching for proven ways to boost your graduate school application form, understanding ...

Prepare for the GRE in 2 Months – Study Plan, Tips & ...
Preparing for the GRE in just two months may sound intense, but with the right strategy, discipline,...

GMAT Sample Questions Papers 2026: Exam Pattern, Questi...
The GMAT (Graduate Management Admission Test) is a pivotal milestone for anyone eager to enter top b...

GMAT Focus Edition Preparation 2026: Strategy, Tips & S...
GMAT is a standardised test required for any candidate who wants to study in a top business school. ...

Best GRE Study Material 2026: Free GRE Prep Books
The GRE has changed to be faster and more streamlined for test takers. In 2026, the test is nearly h...

Best GMAT Coaching in Hyderabad
Choosing the right GMAT coaching institute in Hyderabad is one of the most important decisions for M...

Best GMAT Coaching in Bangalore 2026
Choosing the right GMAT coaching institute in Bangalore is one of the most important decisions for M...

Best GMAT Coaching in Delhi 2026
Choosing the right GMAT coaching institute in Delhi is one of the most important decisions for MBA a...

Best GMAT Coaching in Mumbai 2026
The GMAT, or the Graduate Management Admission Test, is a standardised exam designed to assess a can...


